Build a reporting dashboard
Last modified on 08-Aug-24
This article offers an example for building a data quality reporting dashboard using the Soda Cloud Reporting API. Such a dashboard enables your team to understand how healthy your data is and how the team is using Soda Cloud. The following diagram represents the system this example builds.

Prerequisites and limitations
Set up a virtual Python environment
Set up Python ingestion
Capture data from your Soda Cloud account
Move the captured data into a SQL warehouse
Build a Dataset Health-Over-Time dashboard
Go further
Prerequisites and limitations
- You have some knowledge of Python and are familiar with
pandasand HTTP request libraries such ashttpx. - You have installed Python 3.8, 3.9, or 3.10.
- You have a Soda Cloud account.
- You have installed Soda Library in your environment and connected it to your Soda Cloud account.
- You have used Soda Library to run at least one scan against data in a dataset.
- You are familiar with the Soda Cloud Reporting API.
- This example does not support SSO.
Set up a virtual Python environment
- As per best practice, set up a Python virtual environment for each project you have so that you can keep your setups isolated and avoid library clashes. The example below uses the built-in
venvmodule.python3 -m venv ~/venvs/soda-reporting-api-ingest - Activate the virtual environment using the following command.
source ~/venvs/soda-reporting-api-ingestExample output:
(soda-reporting-api-ingest) -> ~/workspace/soda_reporting_ingestion git(main): - When you have completed this tutorial, you can deactivate your virtual environment using the following command.
deactivate
Set up Python ingestion
- To connect to the API endpoints you want to acccess, use an HTTP request library. This tutorial uses
httpx; use the following command to install it.pip install httpx pandas sqlalchemy - This examples moves the data it captures from your Soda Cloud account into a Snowflake data source; it requires the
snowflake-sqlalchemySQLAlchemy plugin. If you use a different type of warehouse, find a corresponding plugin, or check SQLAlchemy built-in database compatibility.
Alternatively, you can list and save all the requirements in arequirements.txtfile and install them from the command-line usingpip install -r requirements.txt. - Configure a few variables in a Python dictionary to contain static information such as the API URL and the endpoints to which you want to connect. Because the Soda Cloud Reporting API must identify your Soda Cloud account, create a data class to contain your Soda Cloud authentication credentials as per the following. You authenticate to the Reporting API using HTTP Basic Authentication and your Soda Cloud username and password.
from dataclasses import dataclass from typing import Dic import httpx import pandas as p API_MAIN_URL = "https://reporting.cloud.soda.io/v1 ENDPOINTS = { "dataset_health": "/quality/dataset_health", "datasets": "/coverage/datasets", # You can assign defaults in the classes, if you prefer @dataclass class ApiAuth: soda_username: str soda_password: str - All the Soda Cloud Reporting API payloads use the following type of structure.
{
  "resource": "string",
  "data": ...
}
In most cases, the
dataobject is alistofdictsbut for thedataset_coverageendpoint, it is adictofdicts. Therefore, you must define a function calledget_resultswhich issues the HTTP request and returns a well-formed pandas DataFrame.def get_results(url: str, api_credentials: ApiAuth) -> pd.DataFrame: request_result = httpx.post(url, auth=(api_credentials.soda_username, api_credentials.soda_password)) # check that the response is good if request_result.status_code == 200: result_json = request_result.json().get("data", {}) return pd.DataFrame.from_records(result_json) else: raise httpx.RequestError(f"{request_result.status_code=}, {request_result.json()=}")
Capture data from your Soda Cloud account
- Use the following code to capture data from the
datasetsendpoint.api_credentials = ApiAuth(soda_username='fizz@soda.io', soda_password='fizzIsMoreThanBuzzAtSoda') datasets = get_results( f"{API_MAIN_URL}{ENDPOINTS['datasets']}", api_credentials ) - Because the
datasetobject is apandas.DataFrame, view itsheadwith the followingpandascommand.datasets.head()The output appears similar to the following example.
| dataset_id | dataset_name | tags | number_of_failed_tests | is_deleted | last_scan_time | | ------------------------------------ | ------------ | ---- | ---------------------- | ---------- | -------------------------------- | | 0301f146-3a0f-4437-b8cf-974936cbffda | subscription | [] | 0 | False | 2021-09-16T12:43:59.493882+00:00 | | 3927e0eb-e543-4ef5-9626-08cb220cc43a | esg | [] | 1 | False | 2021-07-05T09:26:48.948338+00:00 | | 39628650-59f5-4801-8dfe-5b063e5d611c | products | [] | 3 | False | 2021-11-04T08:13:15.173895+00:00 | | 3b6b8f89-c450-4eb0-b910-92a29a0757a9 | booleancheck | [] | 0 | False | 2021-08-25T12:42:22.133490+00:00 | | 450f5de3-3b79-4fe5-a781-3e7441e06a70 | customers | [] | 3 | False | 2021-11-04T08:12:43.519556+00:00 | - Ensure that the content of the
tagscolumn is compatible with most SQL databases. Because tags in Soda are a list of strings, convert the array into a string of comma-separated strings.datasets["tags"] = datasets["tags"].str.join(',') - The
dataset_healthendpoint tracks the number of tests that passed per dataset per scan date and calculates apercentage_of_passing_teststo use as your dataset health score. Capture the data from this endpoint as the following.dataset_health = get_results( f"{API_MAIN_URL}{ENDPOINTS['dataset_health']}", api_credentials ) dataset_health.head()Example output:
| dataset_id                           | scan_date  | critical | info | warning | number_of_tests | percentage_passing_tests |
| ------------------------------------ | ---------- | -------- | ---- | ------- | --------------- | ------------------------ |
| 0301f146-3a0f-4437-b8cf-974936cbffda | 2021-09-16 | 0        | 1    | 0       | 1               | 100.000000               |
| 3927e0eb-e543-4ef5-9626-08cb220cc43a | 2021-06-24 | 0        | 6    | 0       | 6               | 100.000000               |
| 3927e0eb-e543-4ef5-9626-08cb220cc43a | 2021-06-25 | 1        | 5    | 0       | 6               | 83.333333                |
| 3927e0eb-e543-4ef5-9626-08cb220cc43a | 2021-06-26 | 2        | 4    | 0       | 6               | 66.666667                |
| 3927e0eb-e543-4ef5-9626-08cb220cc43a | 2021-06-27 | 1        | 5    | 0       | 6               | 83.333333                |
The results from the second query produce a
dataset_id, but no name or any of the information you get from thedatasetsquery. When you build a dashboard, you can join the two results so that you can present thedataset_namein the reporting dashboard, rather thandataset_id.
Move the captured data into a SQL warehouse
Having captured the Soda Cloud data that your Analytics Engineers need to compose dashboards, move the data into the storage-and-compute space that your reporting tools use, such as a SQL warehouse. This example uses a Snowflake data source and leverages panda’s to_sql() method, which itself leverages the database abstraction Python library known as SQLAlchemy.
- Define a data class to contain the data source credentials and a function that enables you to move data into a table. If you use a non-Snowflake data source, you may need to modify the credentials class to contain the appropriate parameters.
from sqlalchemy import create_engine from snowflake.sqlalchemy import URL @dataclass class SnowflakeCredentials: account: str = "<your_snowflake_account" user: str = "<your_username3" password: str = "<your_password" database: str = "<target_database>" schema: str = "<target_schema>" warehouse: str = "<snowflake_warehouse_to_use>" def push_to_db( db_credentials: SnowflakeCredentials, df: pd.DataFrame, qualified_target_table_name: str, if_exists: str = "replace", ): db_url_string = URL( account=db_credentials.account, user=db_credentials.user, password=db_credentials.password, database=db_credentials.database, schema=db_credentials.schema, warehouse=db_credentials.warehouse, ) engine = create_engine(db_url_string) df.to_sql(qualified_target_table_name, con=engine, if_exists=if_exists, index=False) - Move the two sets of data into the data source.
push_to_db(SnowflakeCredentials(), datasets, 'datasets_report')
push_to_db(SnowflakeCredentials(), dataset_health, 'dataset_health_report')
Build a Dataset Health-Over-Time dashboard
To build a dashboard, this example uses Redash, an open-source, self-hosted service. You may wish to use a different solution such as Metabase, Lightdash, Looker, or Tableau. To complete the data transformations, this example performs simple transformations directly in Redash, but you may wish to use a transformation tool such as dbt, instead.
- Use a
jointo enrich thedataset_healthdata with thedatasetsdata so as to extract the dataset’s name. This example also adds a Common Table Expression (CTE) that enables you to derive the total number of tests in your account at any given time, and the median number of tests to plot some benchmarks in the visualization.with descriptives as ( select scan_date, median(number_of_tests) median_tests_in_project from reporting_api.dataset_health group by 1 ) select datasets.dataset_name as "dataset_name::filter", -- alias for re-dash dataset-level filter h.scan_date, h.percentage_passing_tests as passing_tests, h.number_of_tests, d.median_tests_in_project, d.stddev_tests_in_project from reporting_api.dataset_health_report h join descriptives d on to_date(h.scan_date) = to_date(d.scan_date) join reporting_api.datasets_report datasets on h.dataset_id = datasets.dataset_id where datasets.is_deleted = false - In Redash, this example uses the alias
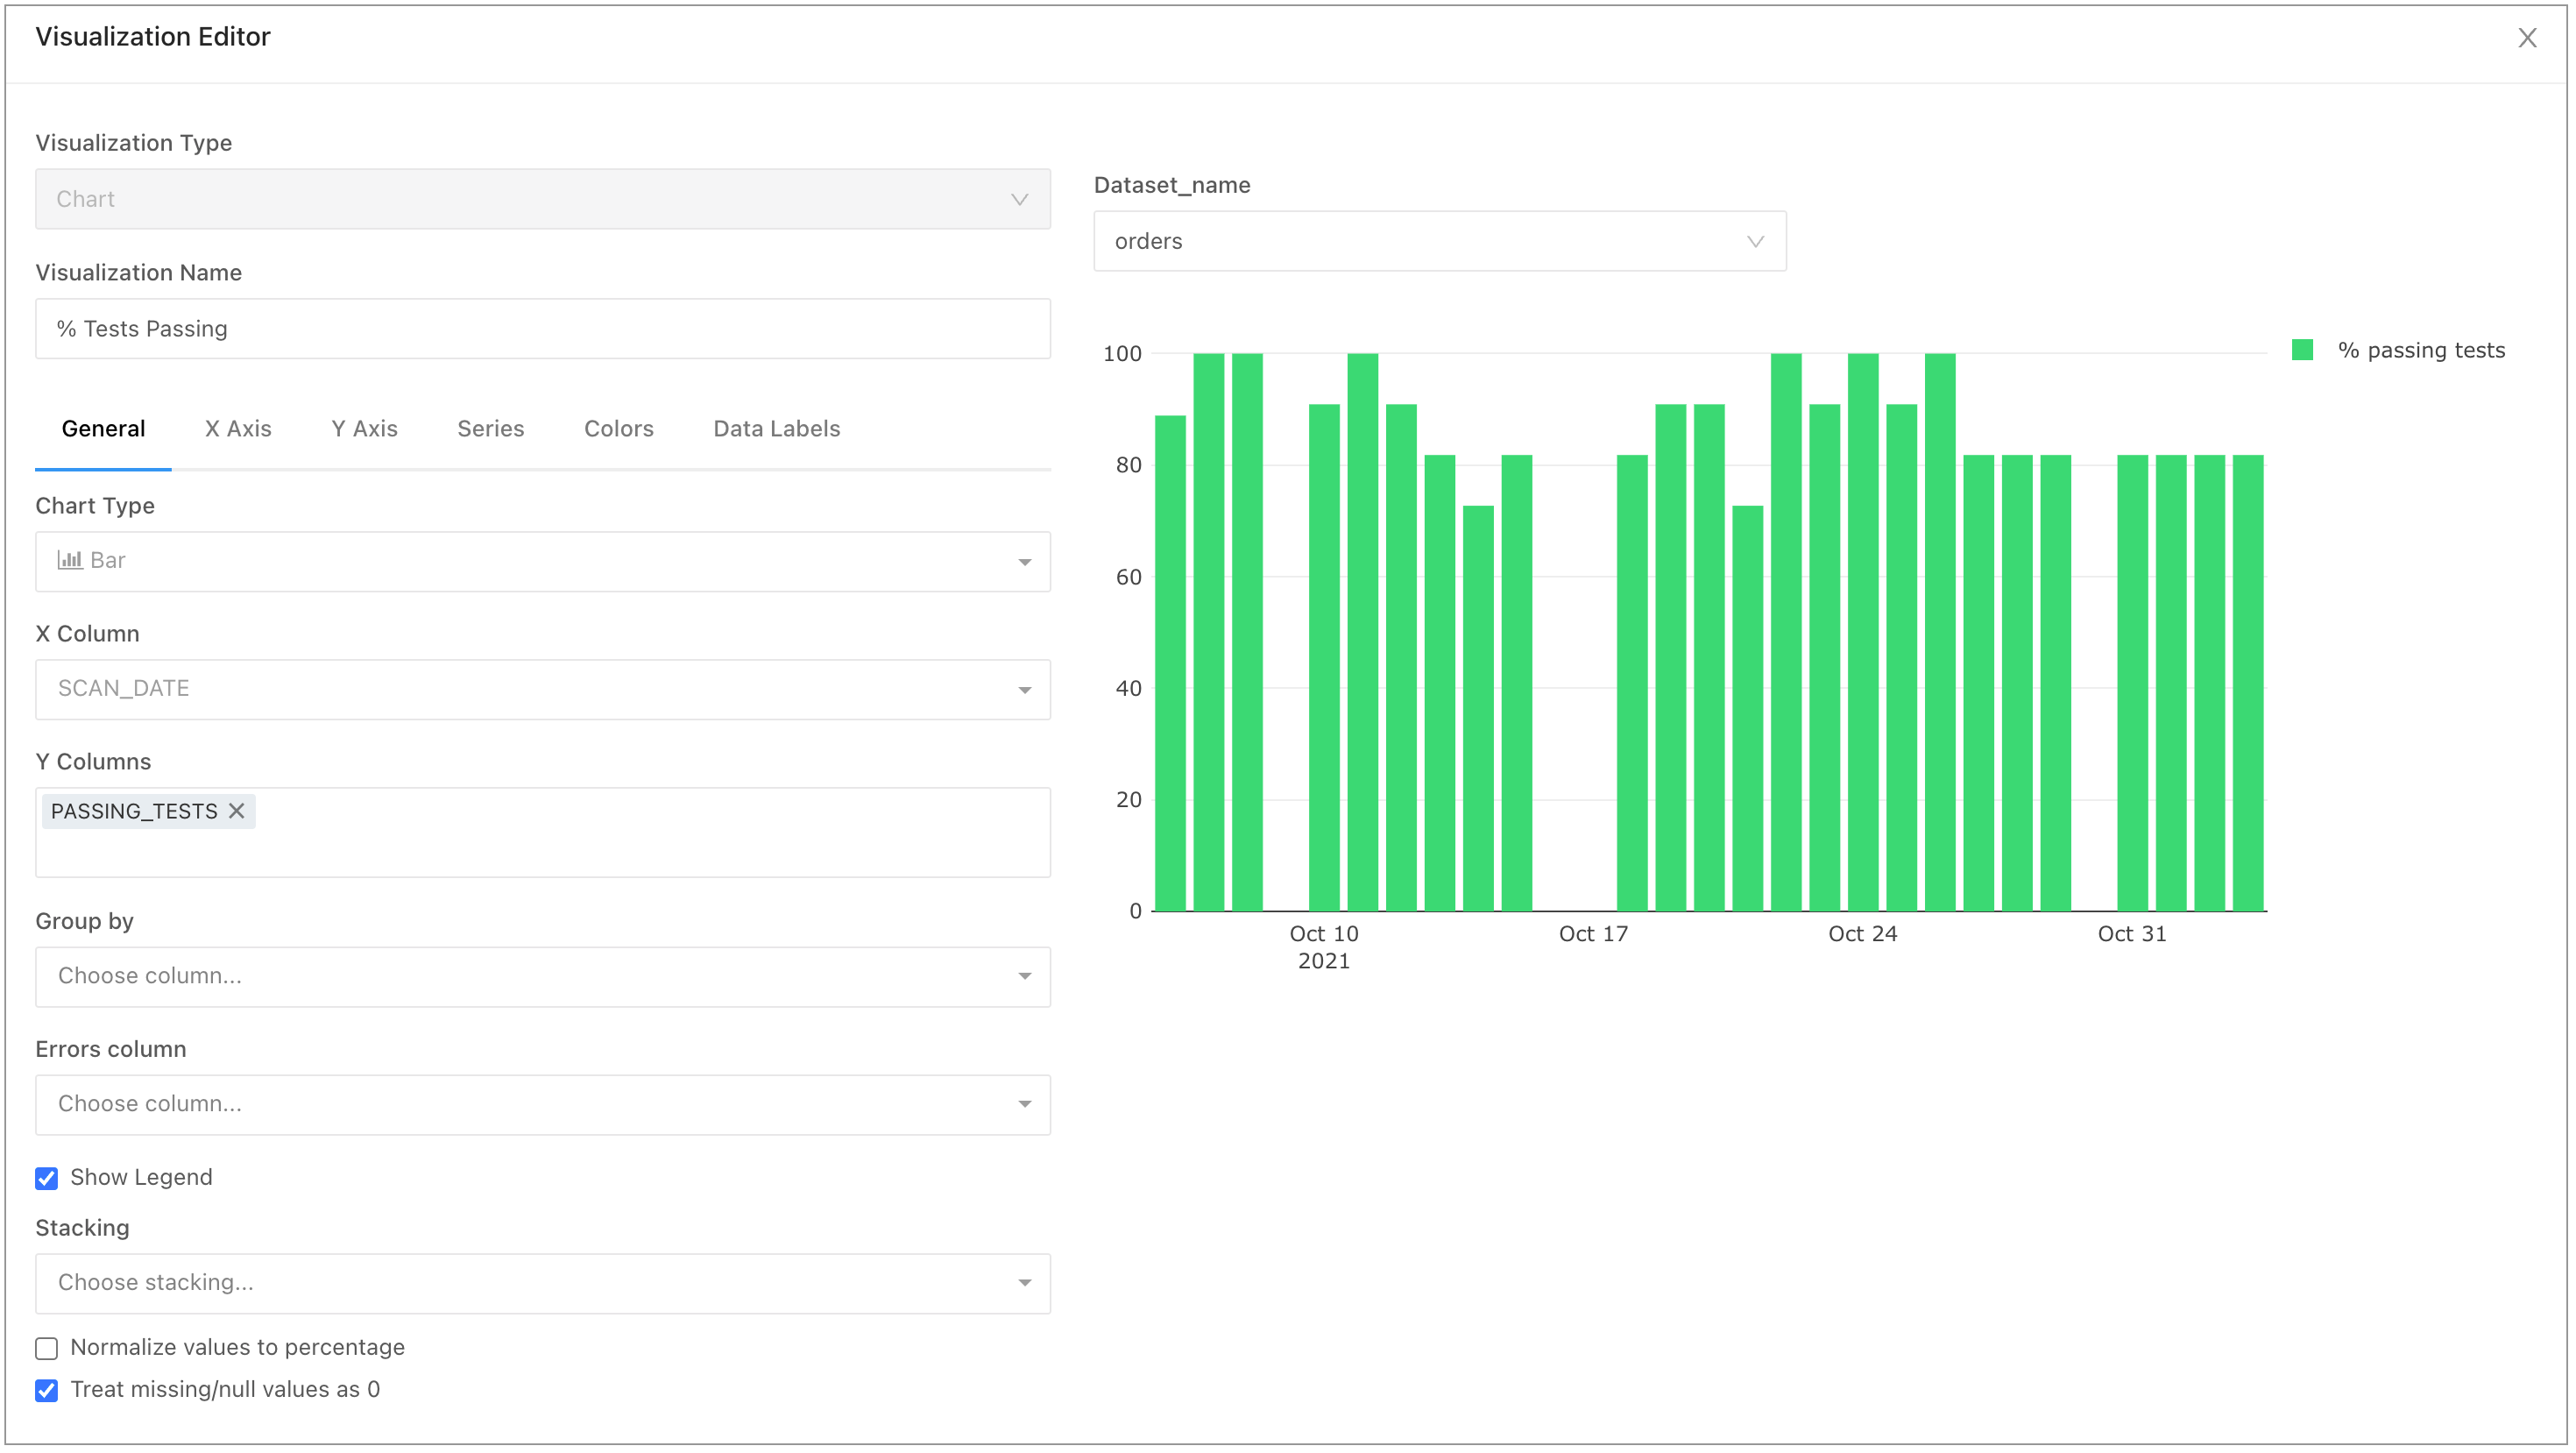
dataset_name::filterto set up a query-filter to filter the whole dashboard. Plot the “% passing test” metric from thedataset_healthover time. In Redash, this example sets up the plot as per the following image.

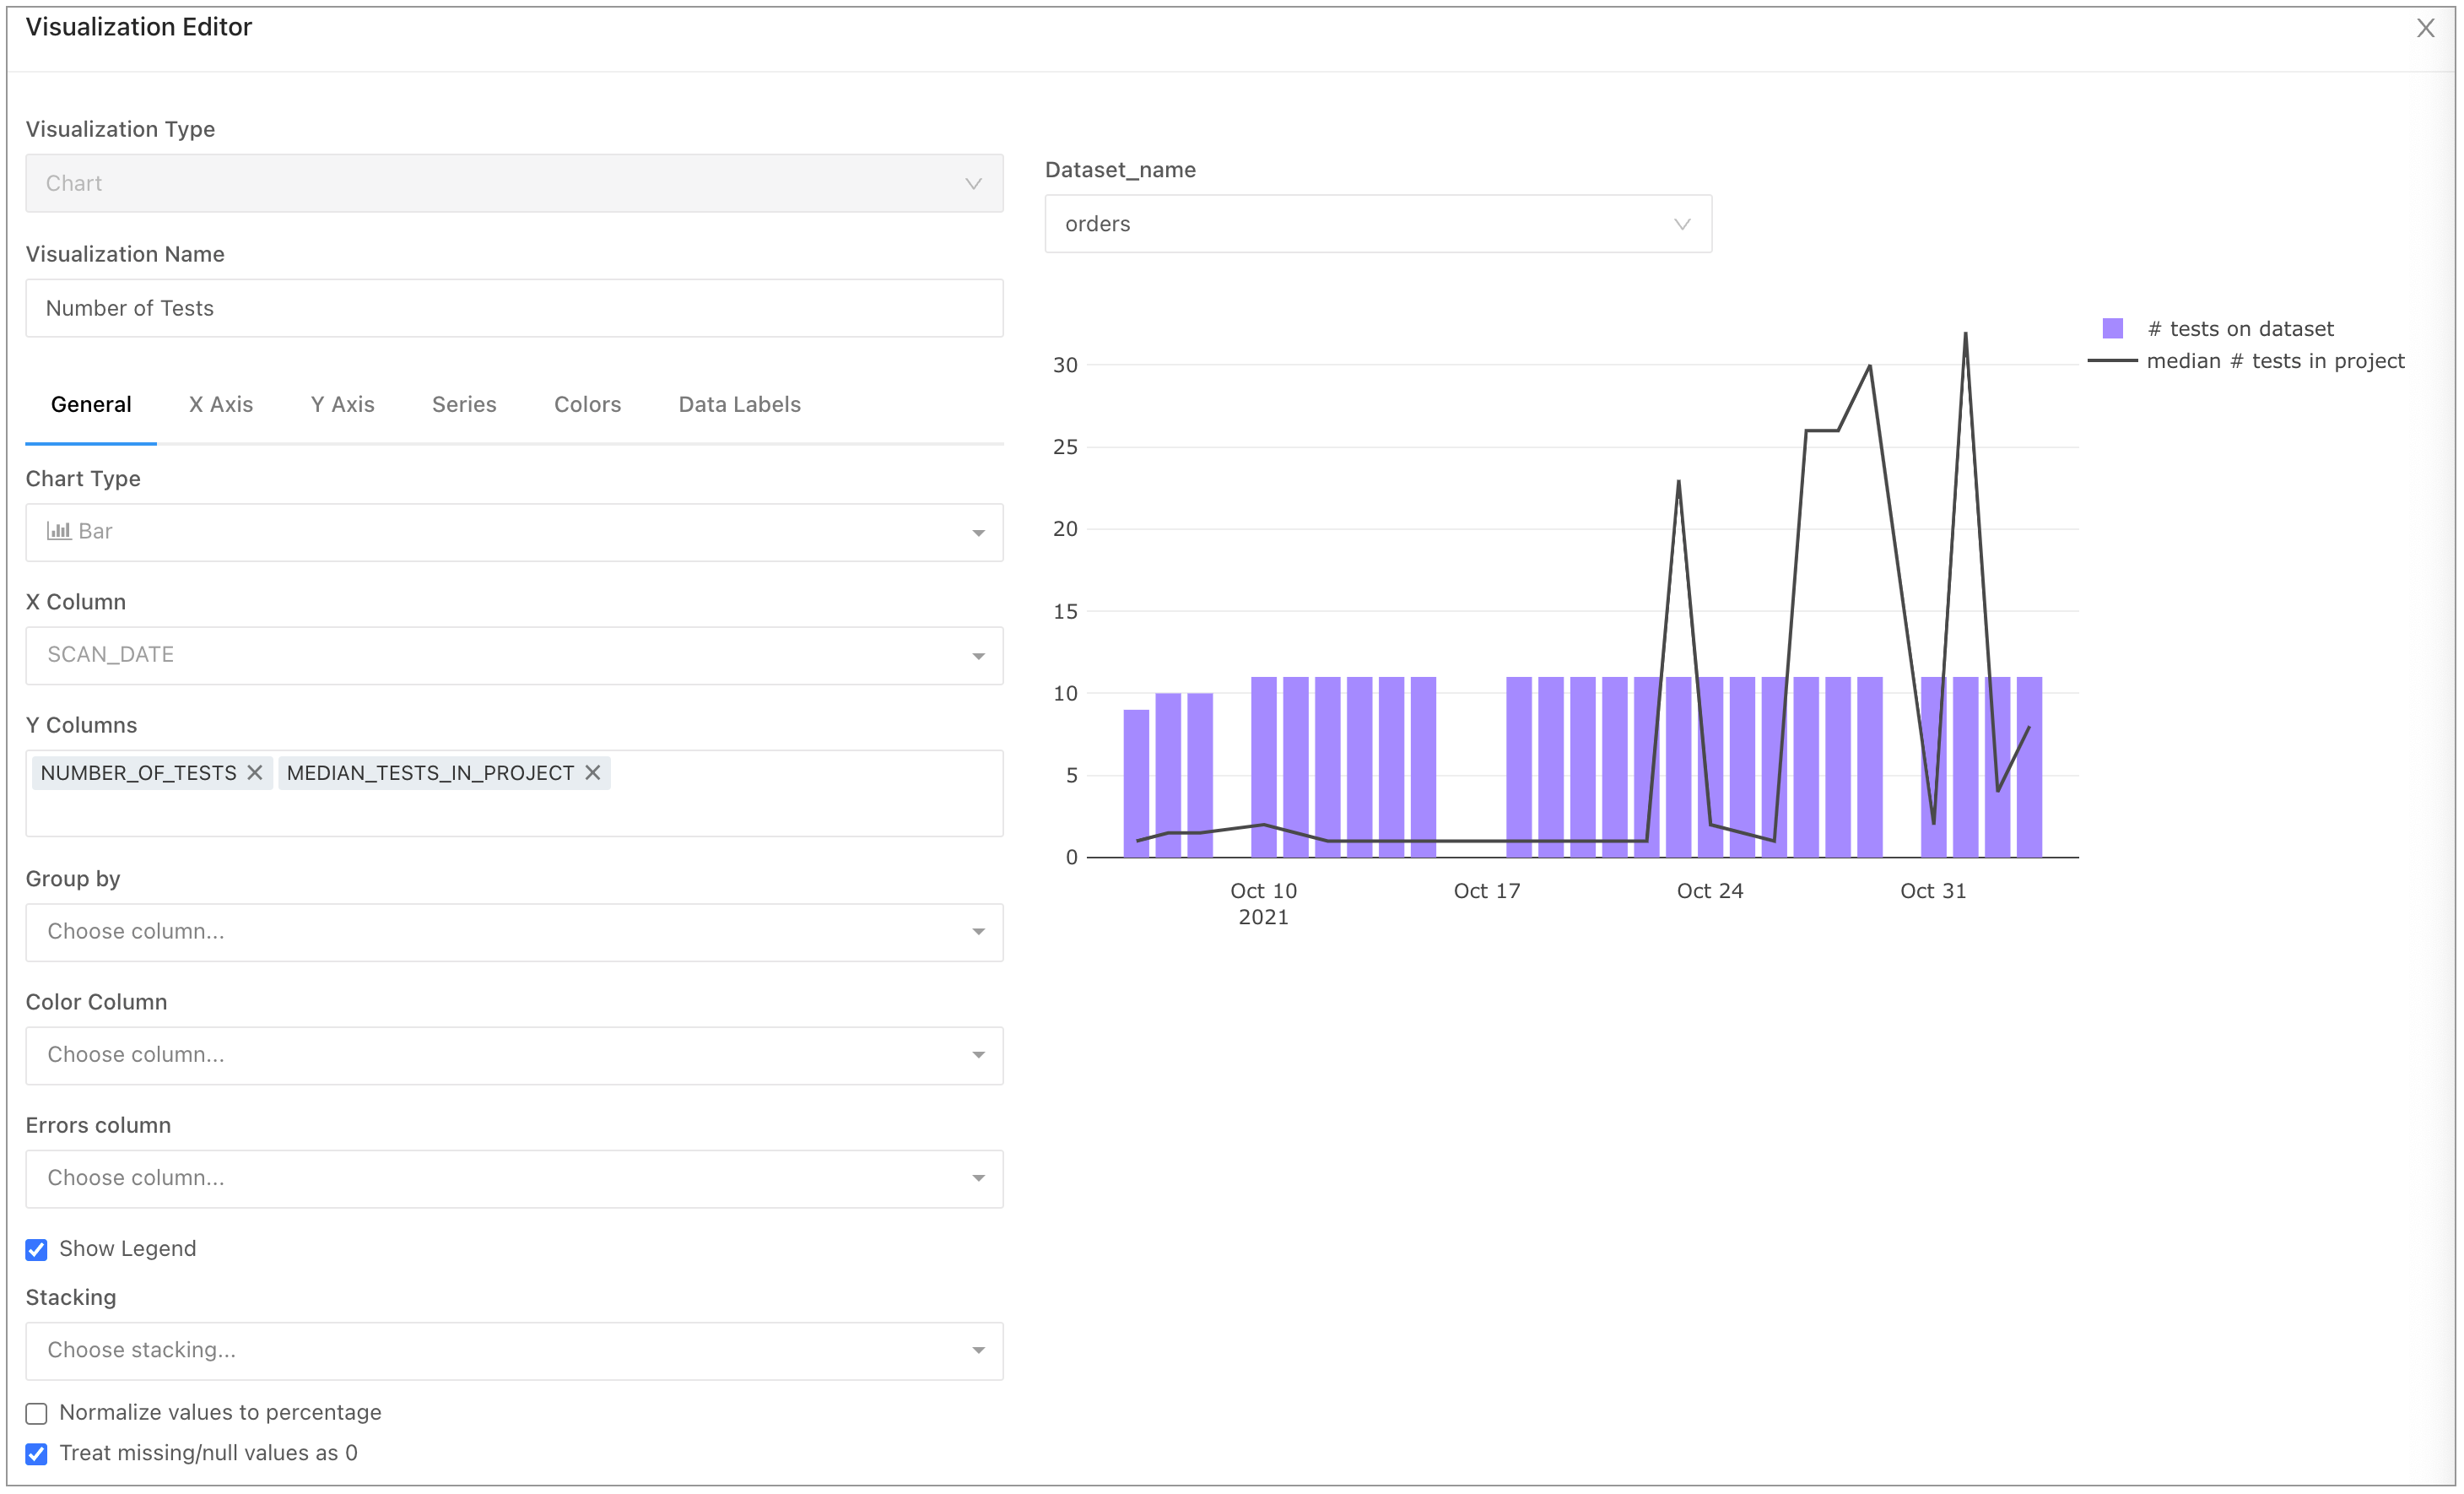
- Make a second plot that displays the number of checks implemented on each dataset over time, as well as a project-wide benchmark, using the median calculation we derived in the SQL query above. Use two other metrics:
- #of tests on dataset
- median number of tests in project
By setting the median number of tests metric as a line, viewers get insight into the check coverage of your dataset relative to other datasets in your project. You can also get similar information from thedataset_coverageendpoint.

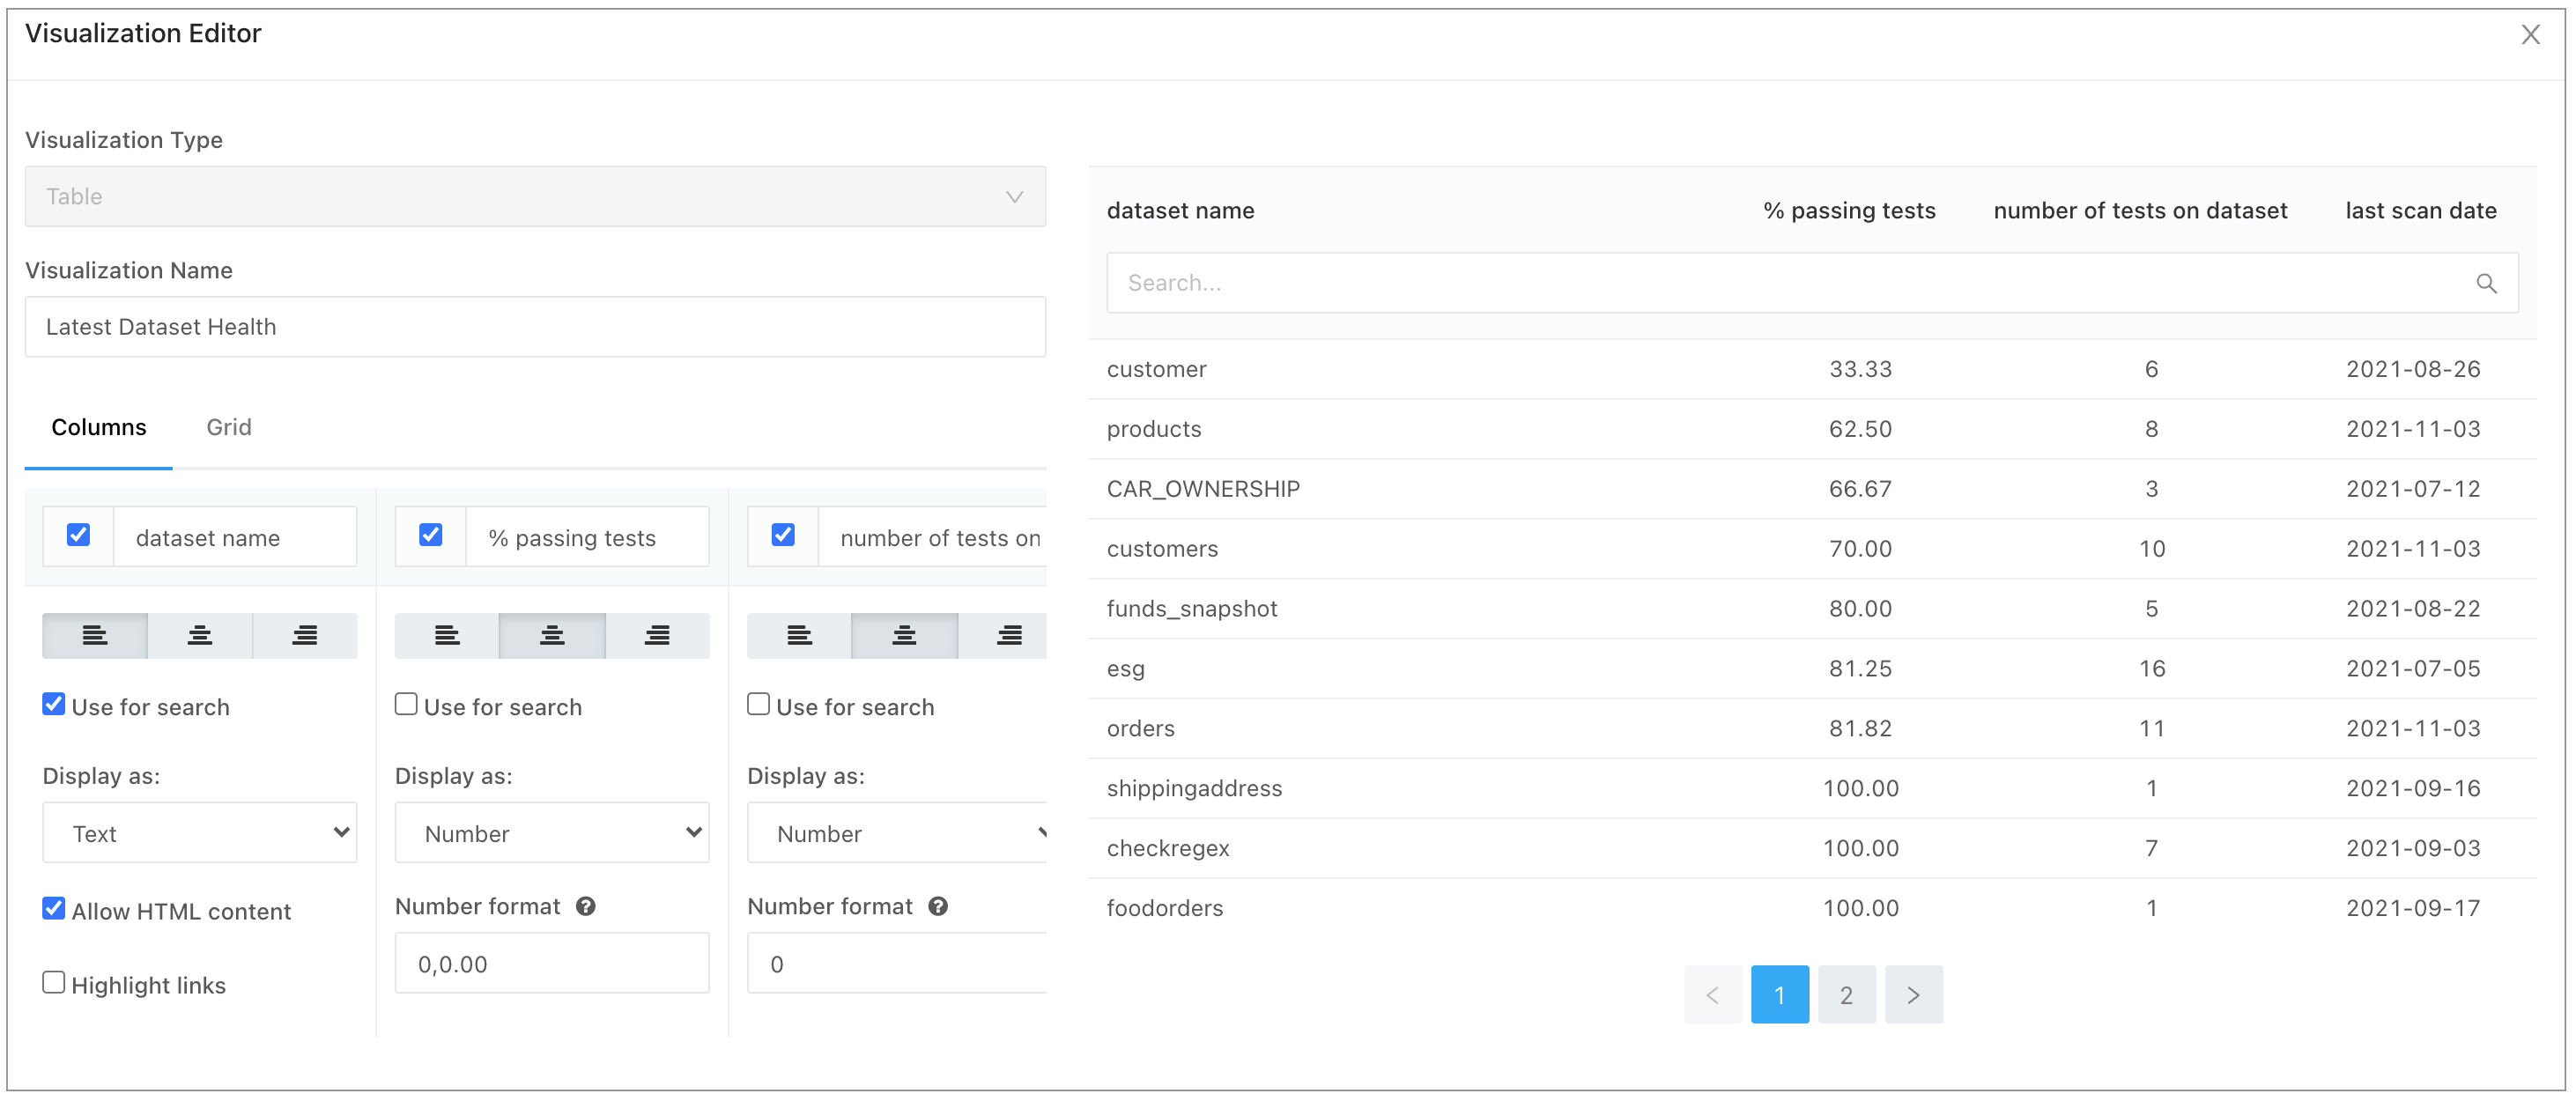
- Make a third plot to get an overview of the latest Dataset Health results for your project. For this plot, the SQL query captures only the last-known scan date for each dataset.
select dataset_name, percentage_passing_tests, number_of_tests, scan_date from reporting_api.dataset_health_report r join reporting_api.datasets_report d on r.dataset_id = d.dataset_id where number_of_tests > 0 qualify row_number() over (partition by dataset_name order by scan_date desc) = 1 order by 2 - Create a table visualization to identify the health of your datasets, as per the following image.

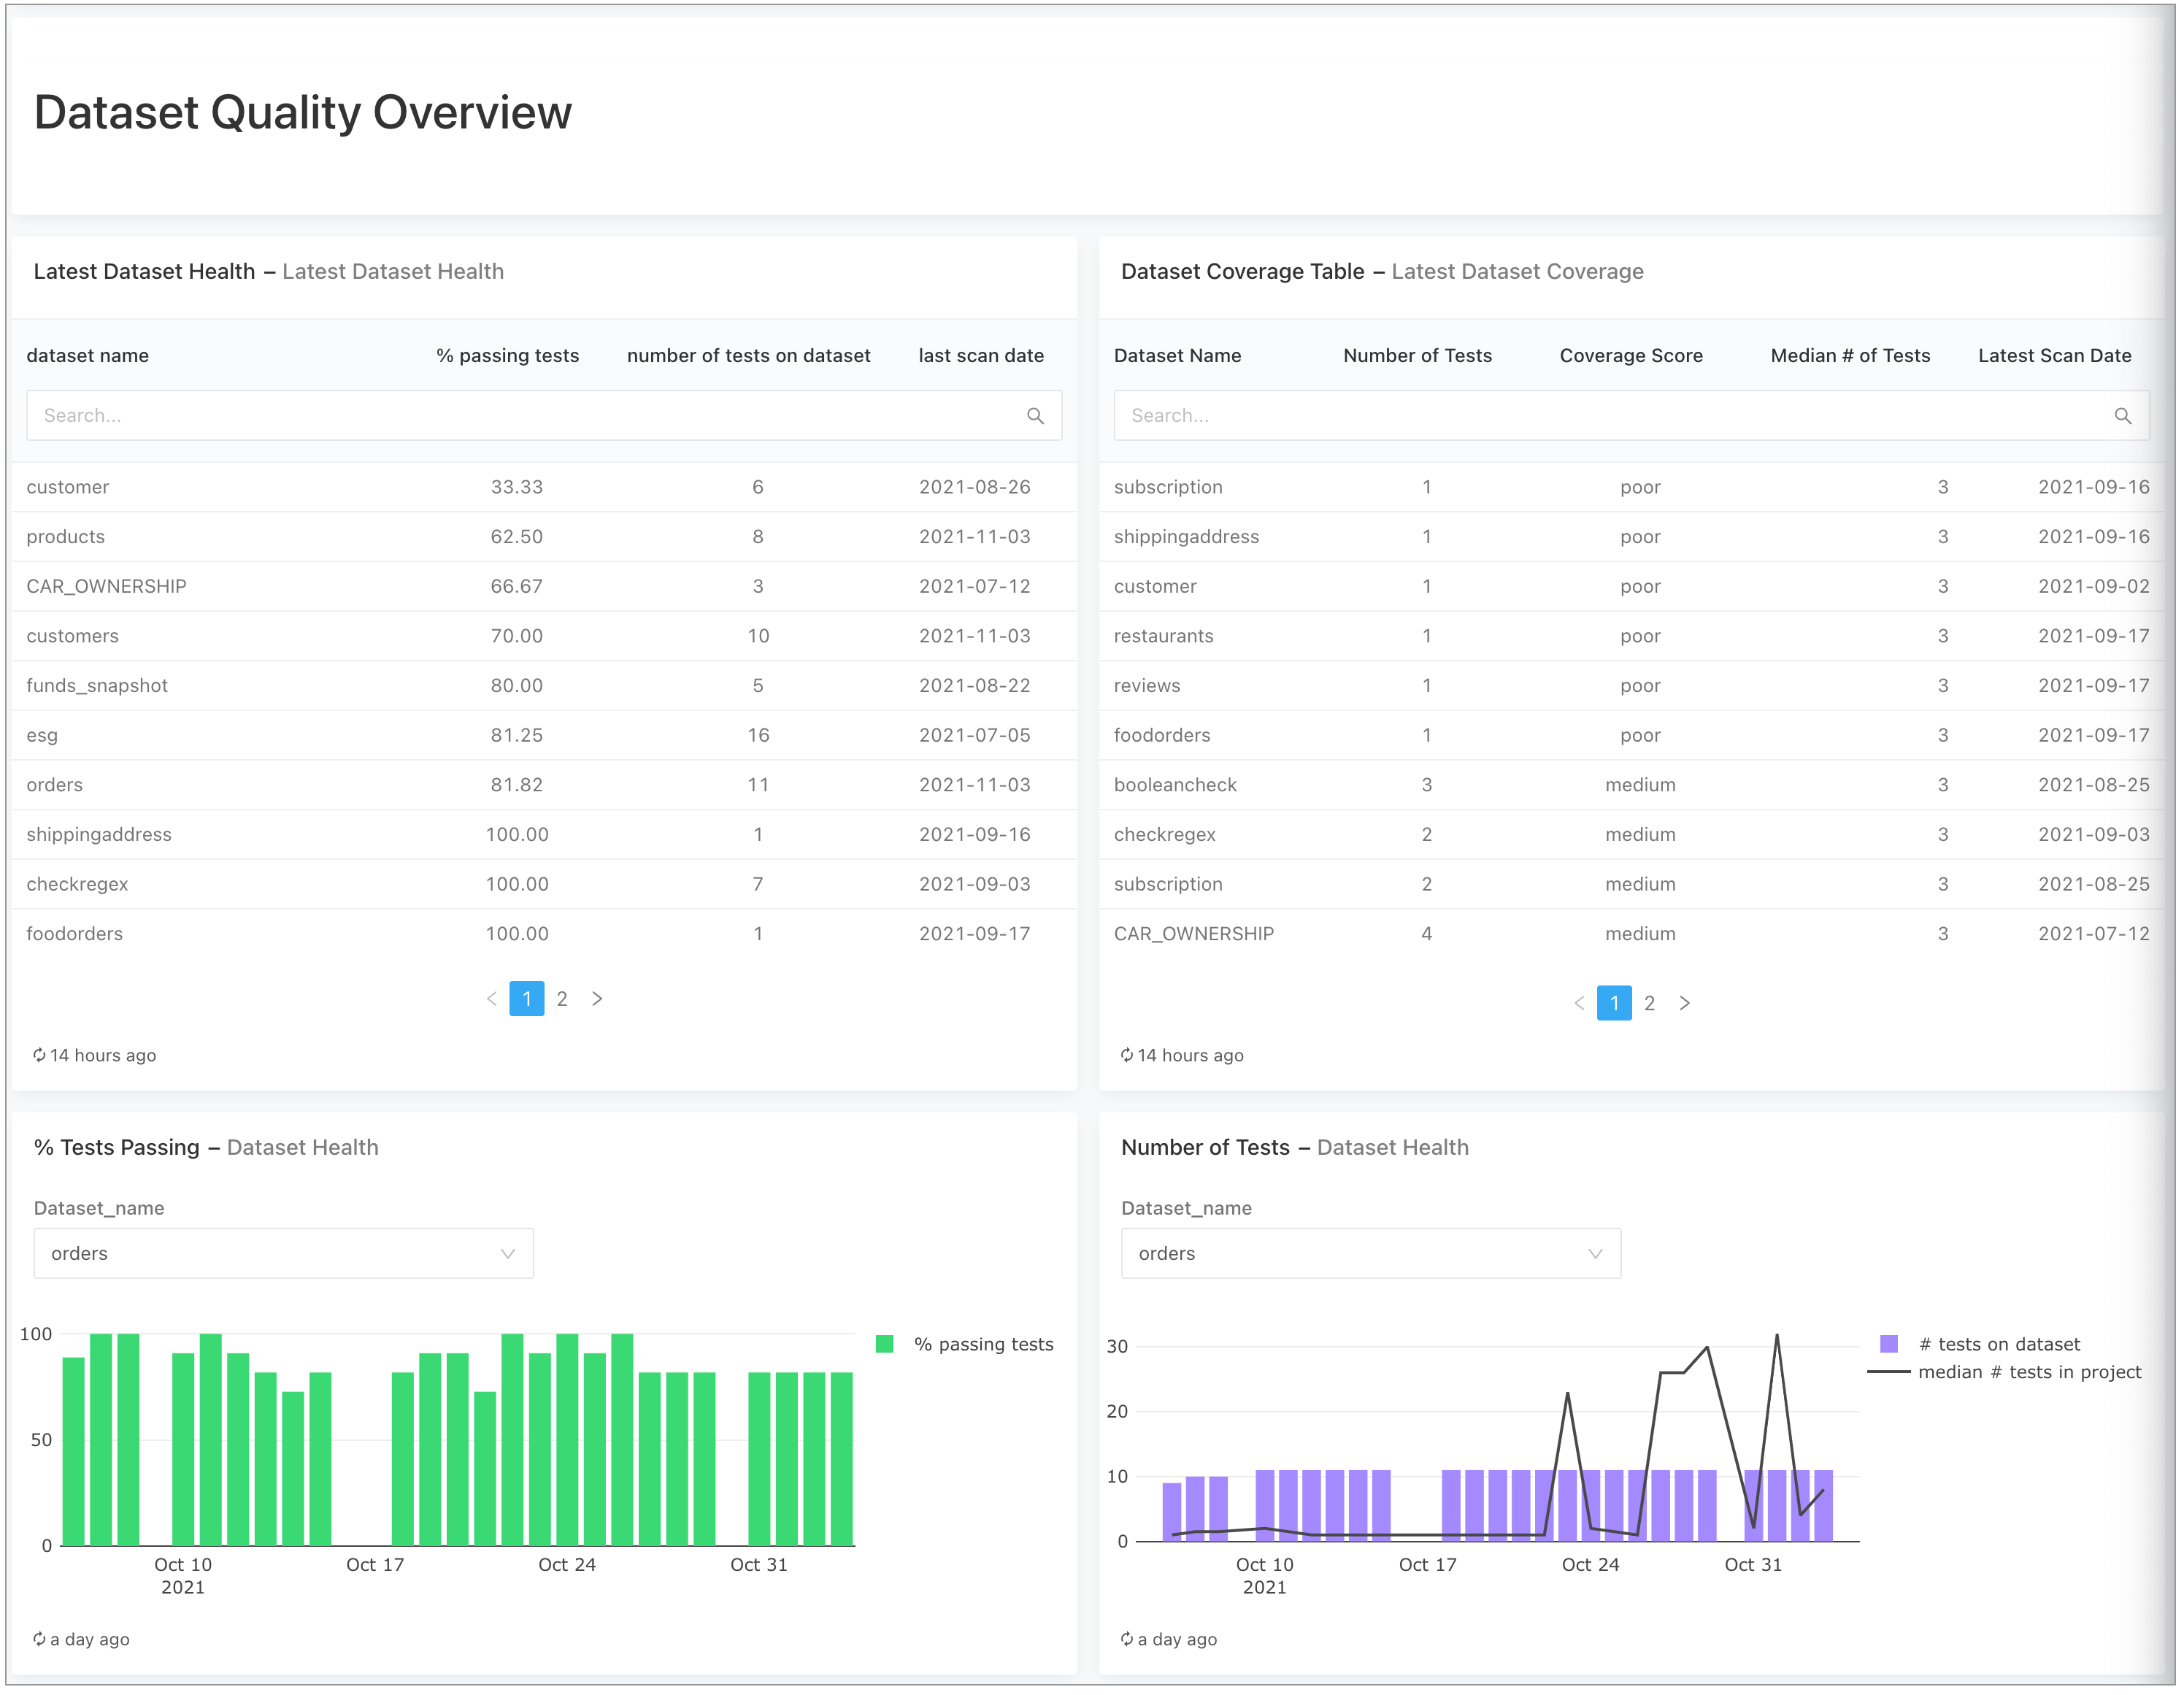
- After creating each visualization from a query, you can add them all to a dashboard that your colleagues can access. In Redash, the example dashboard appears as per the image below and includes a fourth query drawn from the
dataset_coverageendpoint.

Go further
- Access the Reporting API examples repository) in GitHub to get all the code snippets as a Python script that you can run and/or modify. Clone the repo to get started.
- Need help? Join the Soda community on Slack.
- Open issues on the Reporting API examples repository in GitHub.
Was this documentation helpful?
What could we do to improve this page?
- Suggest a docs change in GitHub.
- Share feedback in the Soda community on Slack.
Documentation always applies to the latest version of Soda products
Last modified on 08-Aug-24